Ethical Business
Footprint & Offset
Manufacturing textiles requires the burning off fossil fuels either to create electricity to power machinery and equipment or to fuel the transport of materials and people.
We break down the multiple stages involved in manufacturing and analyse the power required at each stage.
An example for an embroidered cotton bedsheet is illustrated below.
Summary of emissions per duvet cover
broken down by life cycle stage (kgCO2e/duvet cover)
Product
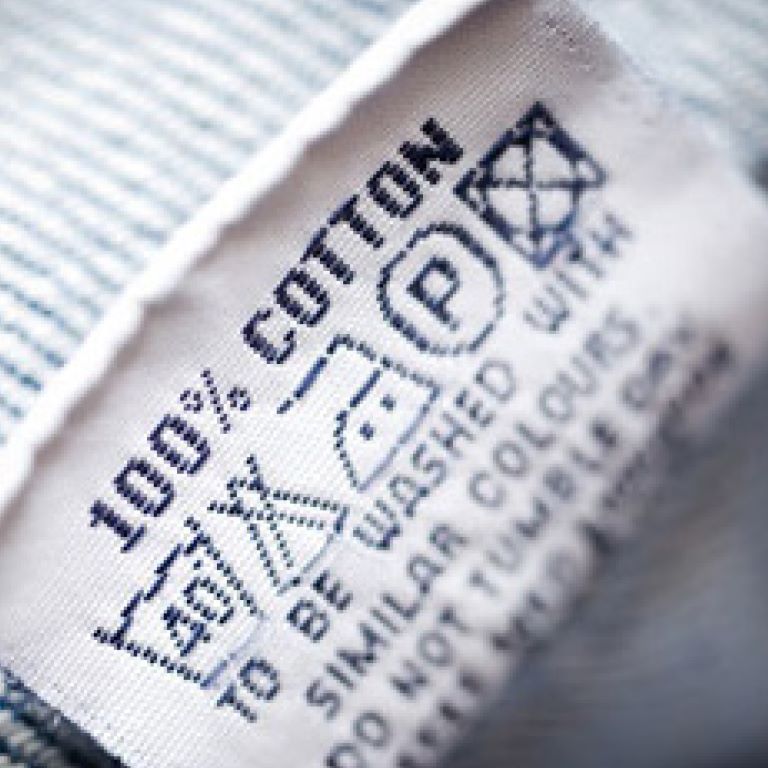
100% Cotton Embroidered Duvet Cover
KPI
12.3 kgCO2e per Duvet Cover
| Scope | kgCO2e/duvet cover | % | |
|---|---|---|---|
| Raw Materials | 10.7 | 87% | |
| Transportation to factories | 0.13 | 1.1% | |
| Production | 1.4 | 11% | |
| Transportation to shops | 0.14 | 1.1% | |
| Total | 12.3 | 100% |
| Category | Item | Quantity | Unit | Source | |
|---|---|---|---|---|---|
| Raw materials | Emissions fromCotton Fabric | 6.78 | kgCO2/Kilogram | University of Bath 2011 | |
| Raw materials | Emissions from50% Cotton/50% Polyester Fabric | 5.89 | kgCO2/Kilogram | University of Bath 2011/Stormberg 2008 | |
| Raw materials | Emissions from Rayon Thread | 9.14 | kgCO2/Kilogram | University of Bath 2011 | |
| Raw materials | Emissions fromPlastic | 3.281 | kgCO2e/Kilogram of Average Rigid Plastic | Defra 2011 | |
| Raw materials | Emissions from Polyester | 5 | kgCO2/Kilogram | Stormberg 2008 | |
| Raw materials | Emissions from Polyurethane | 3 | kgCO2/Kilogram | University of Bath v1.6a | |
| Raw materials | Emissions from Polyurethane | 1.94 | kgCO2/Kilogram | University of Bath v1.6a | |
| Raw materials | Emissions from PVC | 2.41 | kgCO2/Kilogram | University of Bath v1.6a | |
| Raw materials | Emissions from cardboard | 0.0613 | kgCO2/Kilogram | FEFCO 2008 | |
| Raw materials | Emissions from wood containing paper | 0.79 | kgCO2/Kilogram | Paper Profiles - Ecometrica Database | |
| Raw materials | Emissions from Plastic Film (Cotton Duvet Cover) | 2.13 | kgCO2/Kilogramof LDPE Film | University of Bath 2011 | |
| Raw materials | Emissions from Plastic Film (Poly Cotton Duvet Cover) | 2.6 | kgCO2/Kilogramof LDPE Film | ||
| Raw materials | Emissions from Paper Bag | 0.246 | kgCO2e/Kilogramof Kraft Paper | Paper Profiles - Ecometrica Database | |
| Transportation to factories | Emissions for rigid diesel trucks | 0.31204 | kgCO2e/ Tonne.Kilometre | Defra 2011 | |
| Production | Emissions from grid electricity in China | 0.93743 | kgCO2e/ Kilowatt Hour | Defra 2011 | |
| Production | Emissions attributed to systems disposing of recycled waste | 0 | kgCO2e/Kilogram of recycled waste | ||
| Production | Emissions from landfilled plastic | 34 | kgCO2e/ Tonne | ||
| Production | Emissions from Waste Landfill | 40.1 | kgCH4/ Metric Tonne | IPCC (2006). Revised IPCC Guidelines for National Greenhouse Gas Inventories: Reference Manual | |
| Transportation to shops | Emissions from Air Freight Deliveries | 1337 | kgCO2/ Tonne Kilometre | Defra/DECC (2011). Guidelines to Defra/DECC’s GHG conversion factors for company reporting | |
| Transportation to shops | Emissions from Sea Freight Deliveries | 0.00349 | kgCO2/ Tonne Kilometre | Defra/DECC (2011). Guidelines to Defra/DECC’s GHG conversion factors for company reporting |
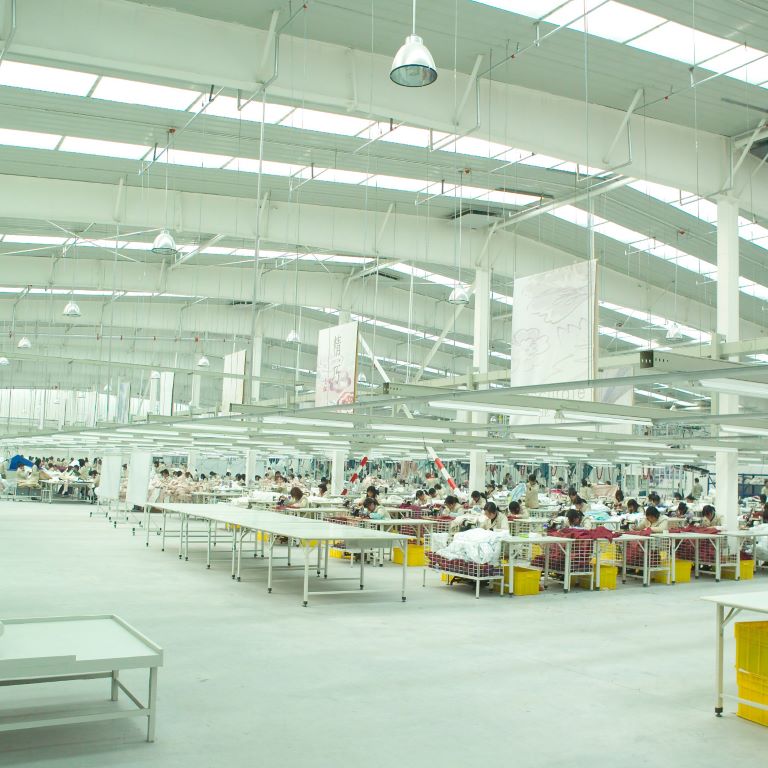
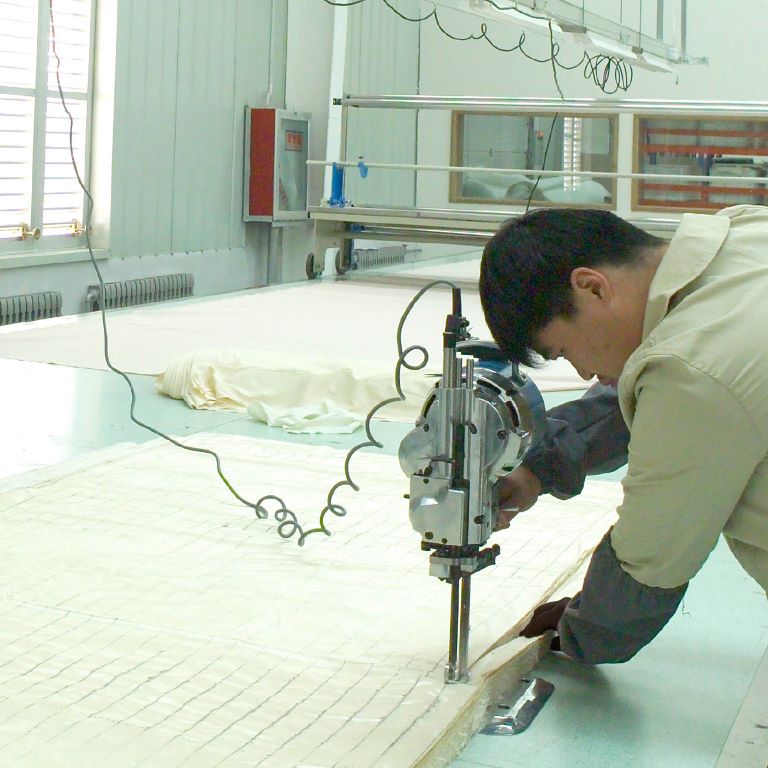
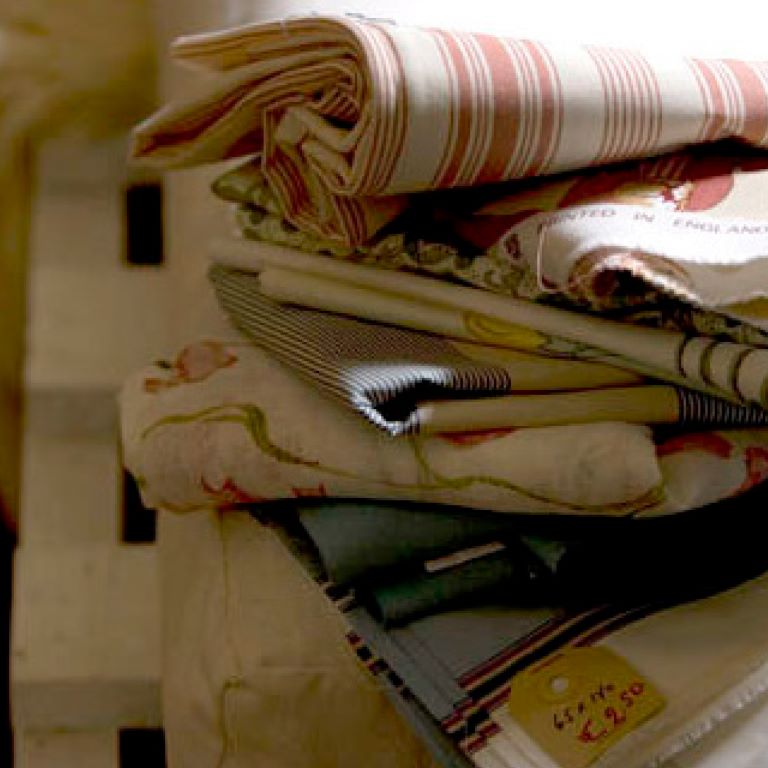
A Closer Look
To bring the manufacturing process to life, opposite you’ll see the steps taken to produce our carbon neutral products; taking you on a journey from seed to store.
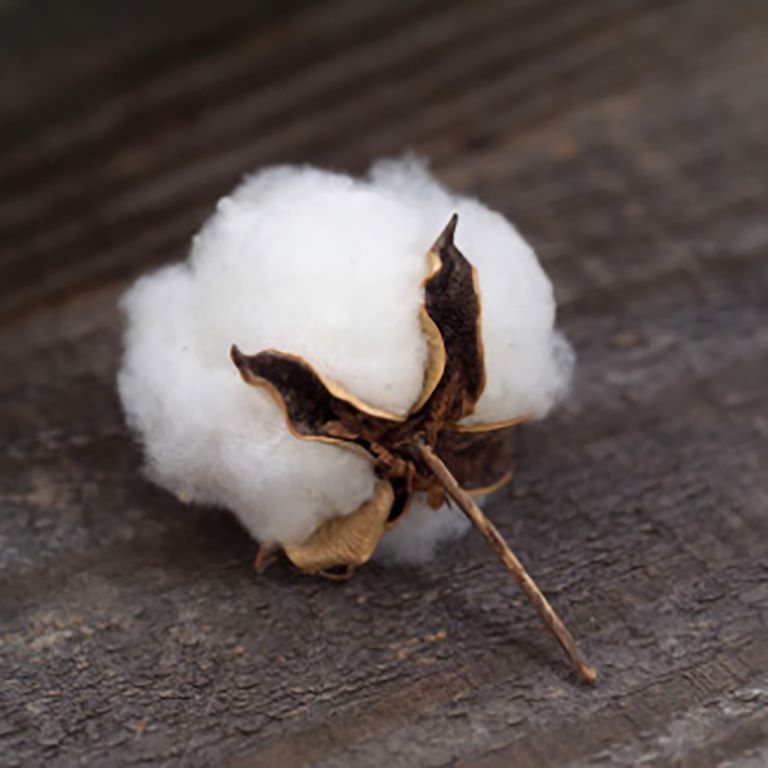
cotton fabric
6.78 kgC02/ Kilogram
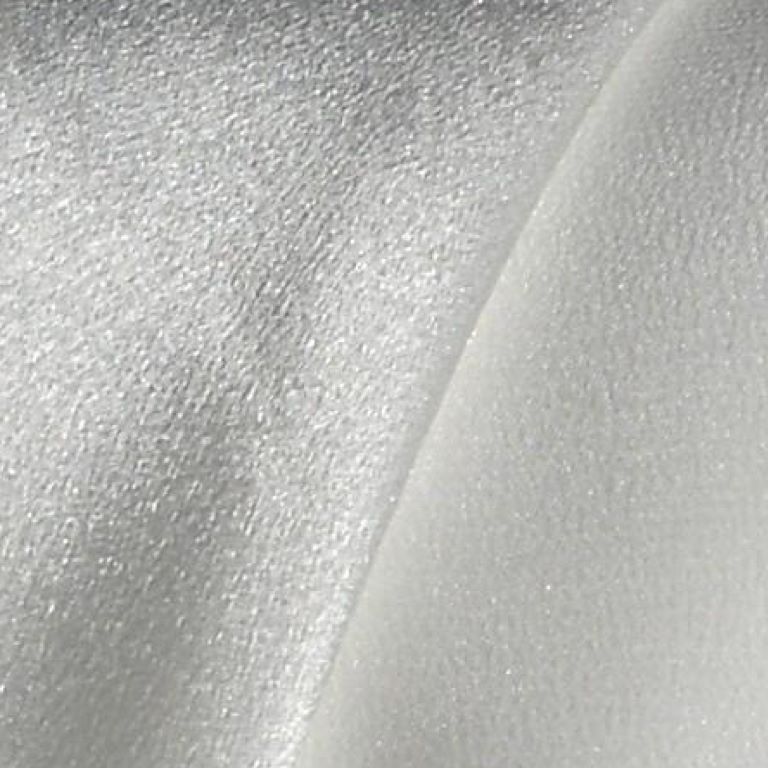
synthetic fabric
1.94-3 kgC02/ Kilogram
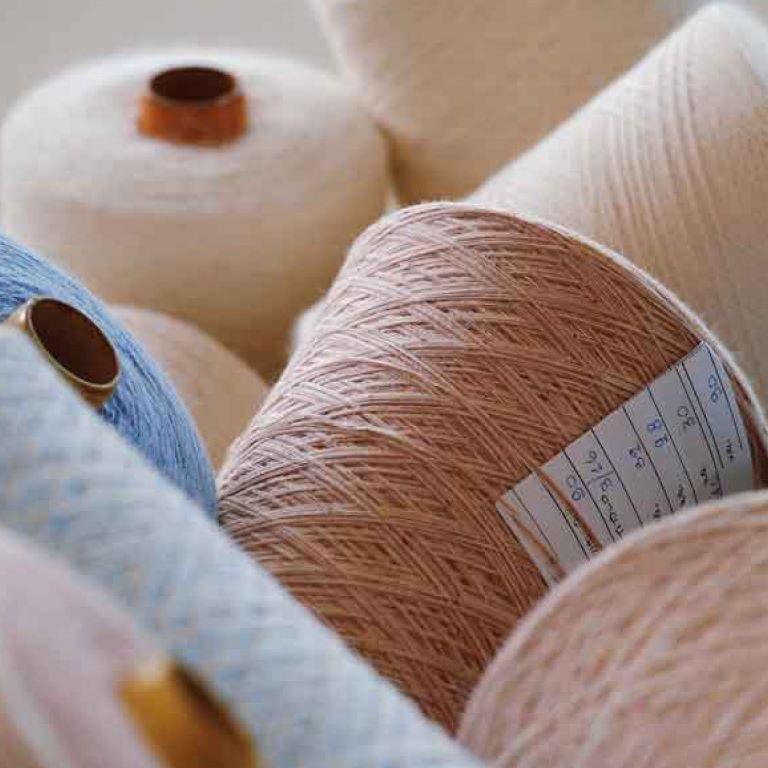
rayon thread
9.14 kgC02/ Kilogram
polyester label
5 kgC02/ Kilogram
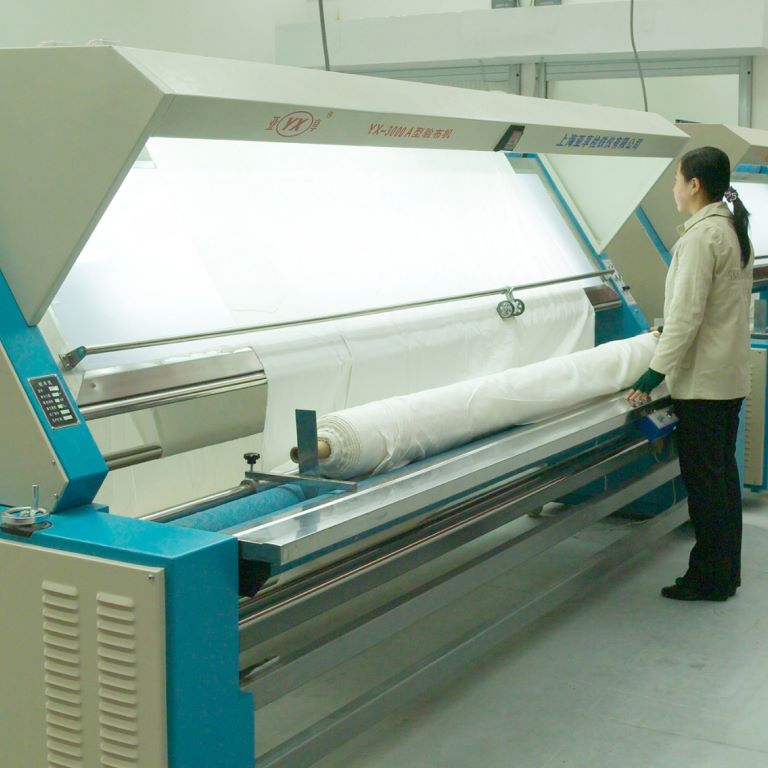
grid electricity in China
0.93743 kgCO2e/Kilowatt Hour
grid electricity in China
0.93743 kgCO2e/Kilowatt Hour
raw material delivery
0.31204 kgC02e/ Tonne Kilometre
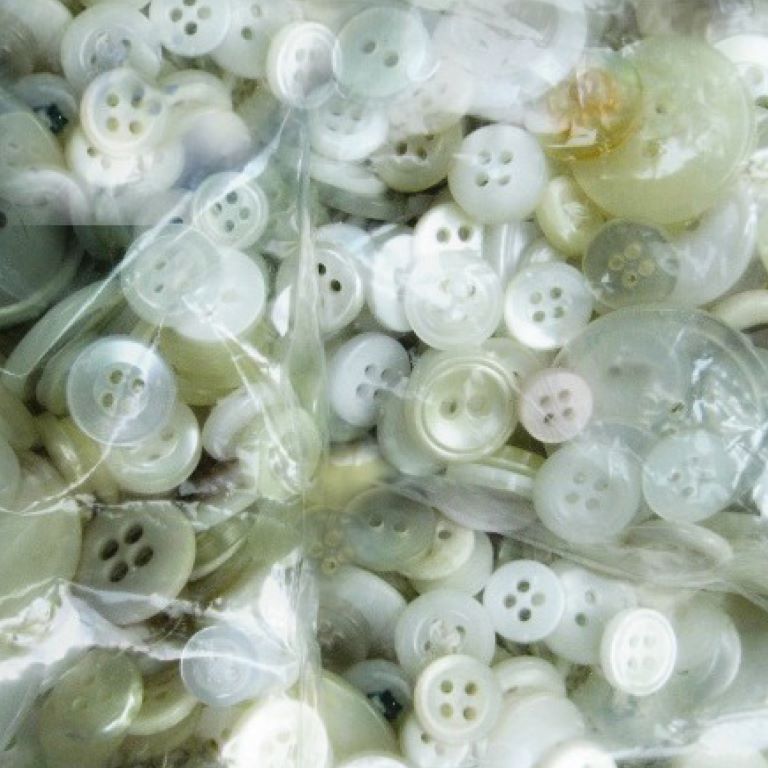
plastic button
3.281 kg CO2e/Kilogram of average rigid plastic
grid electricity in China
0.93743 kgCO2e/Kilowatt Hour
waste landfill
40.1 kgCH4/Metric Tonne
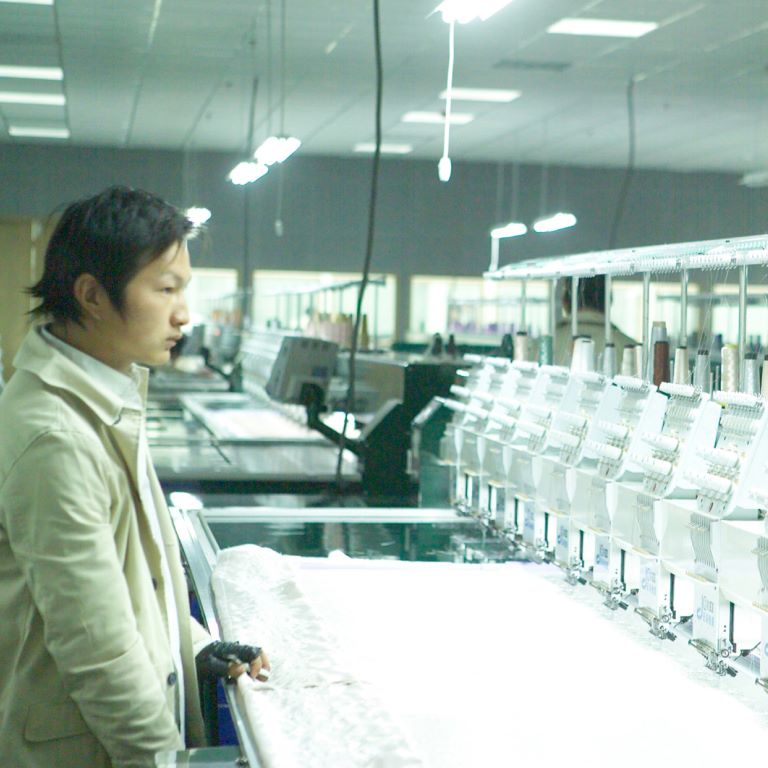
embroidery
0.93743 kgCO2e/Kilowatt Hour
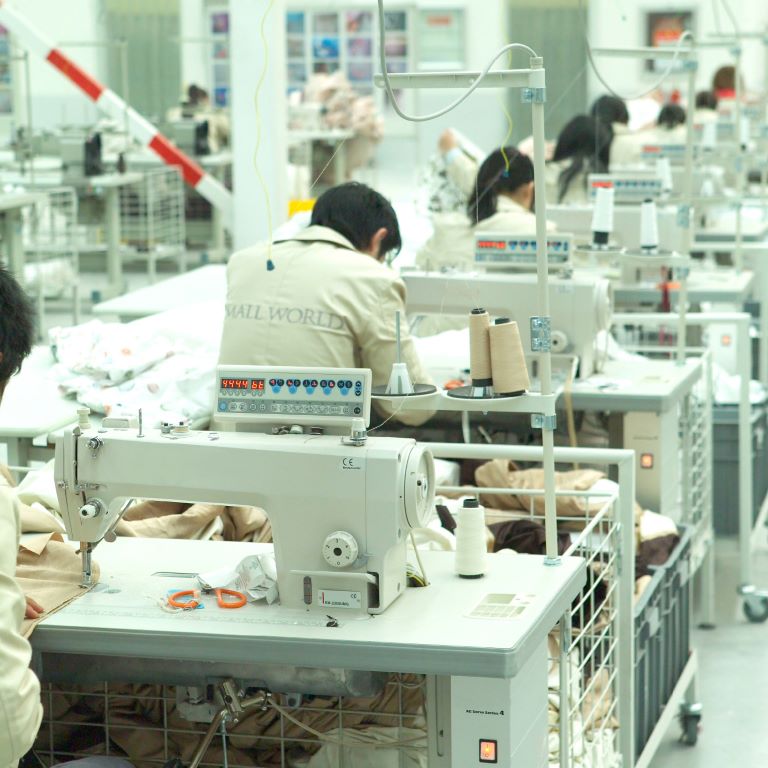
sewing
0.93743 kgCO2e/Kilowatt Hour
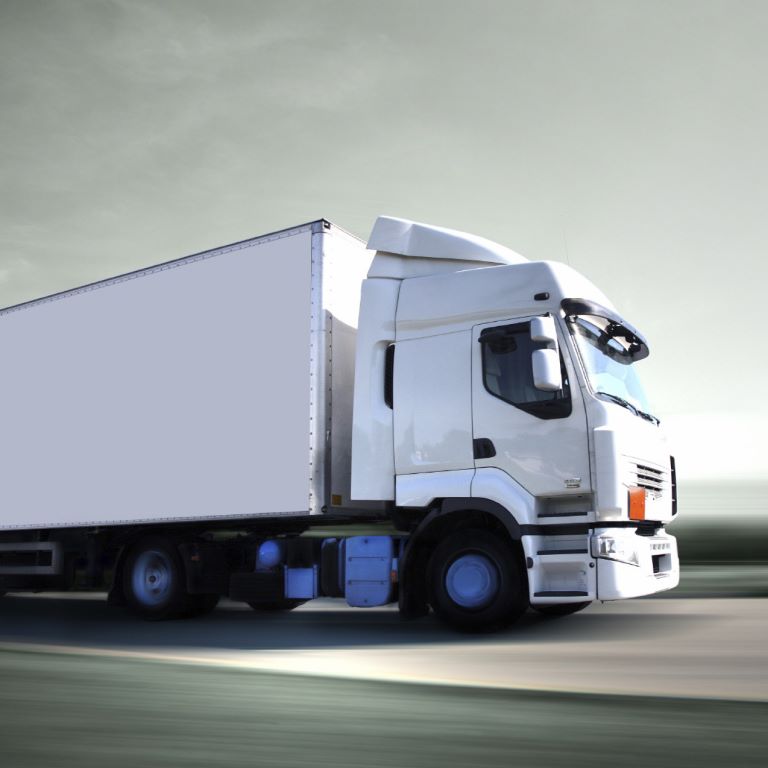
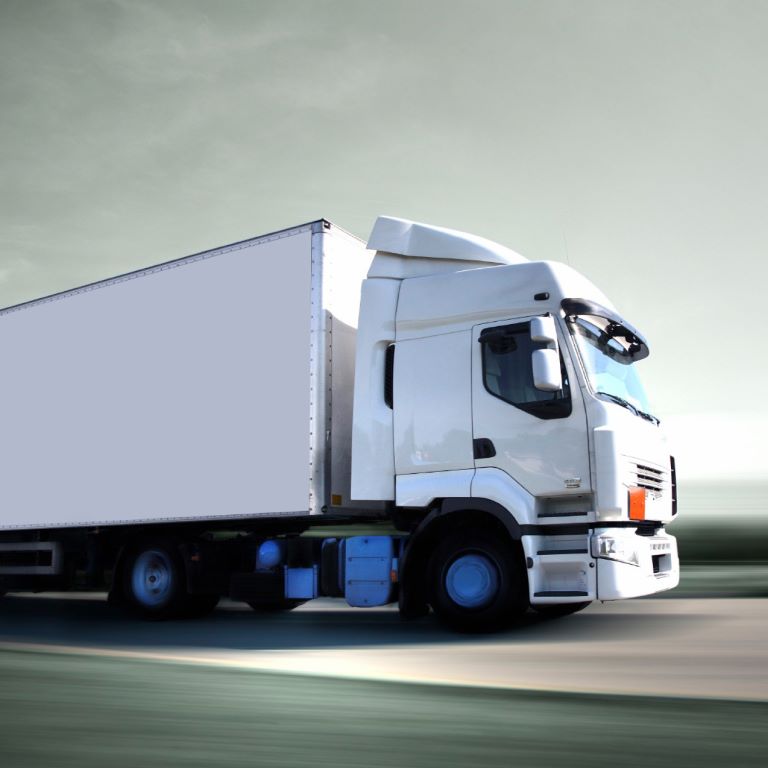
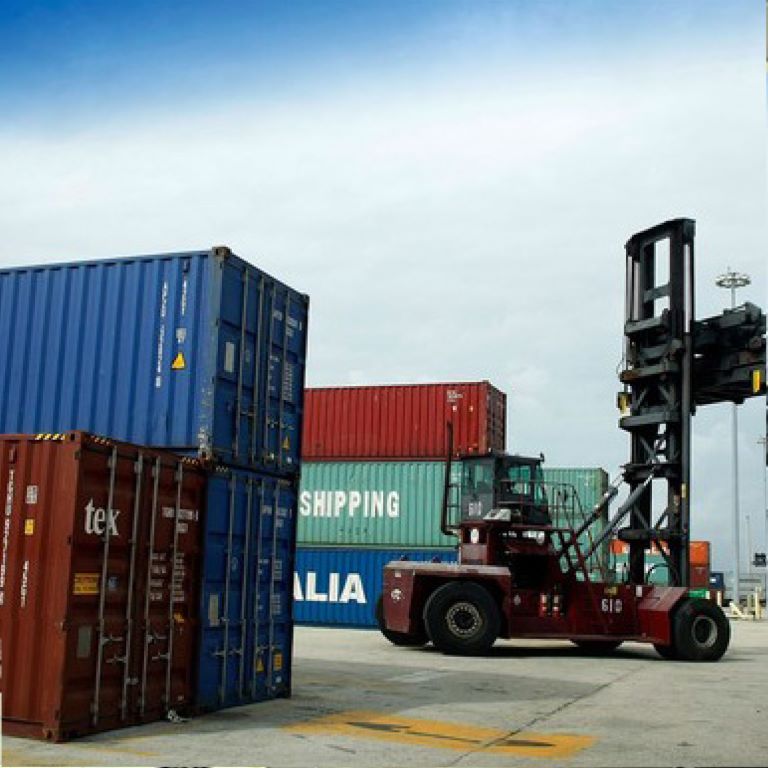
truck to port
0.31204 kgC02e/ Tonne Kilometre
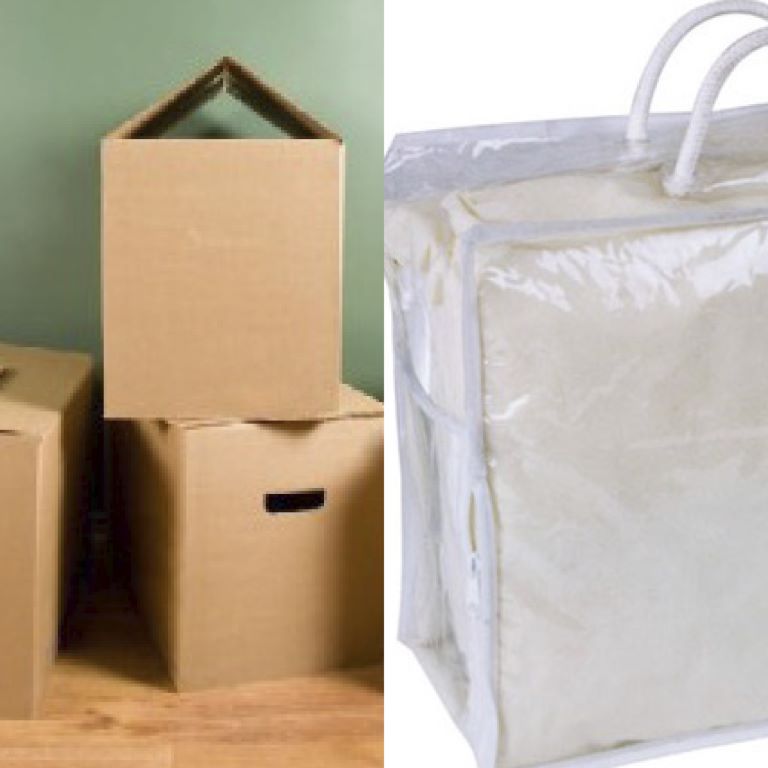
cardboard / pvc bag
0.0613 / 0.79 kg CO2e/Kilogram
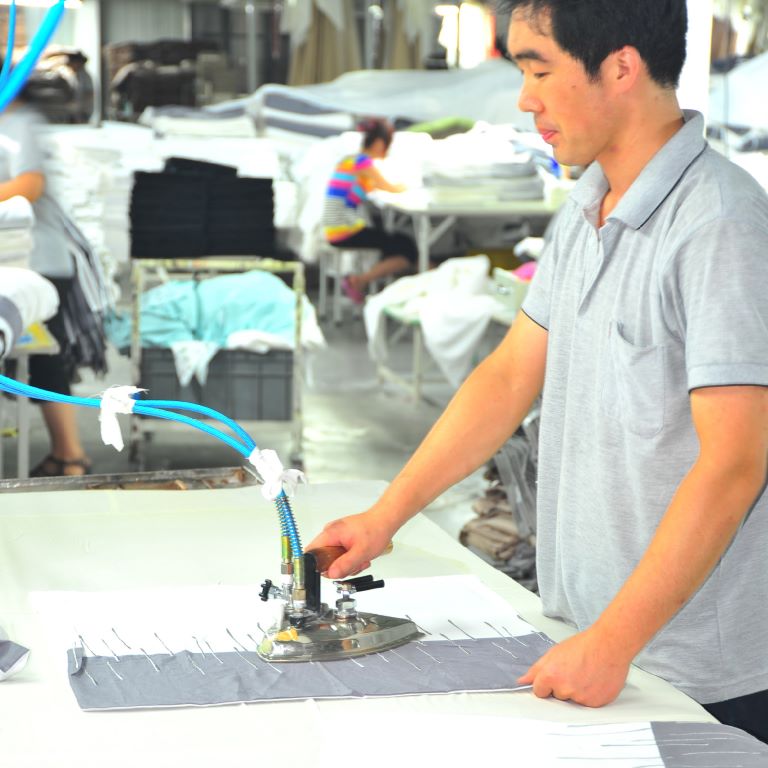
ironing
0.93743 kgCO2e/Kilowatt Hour
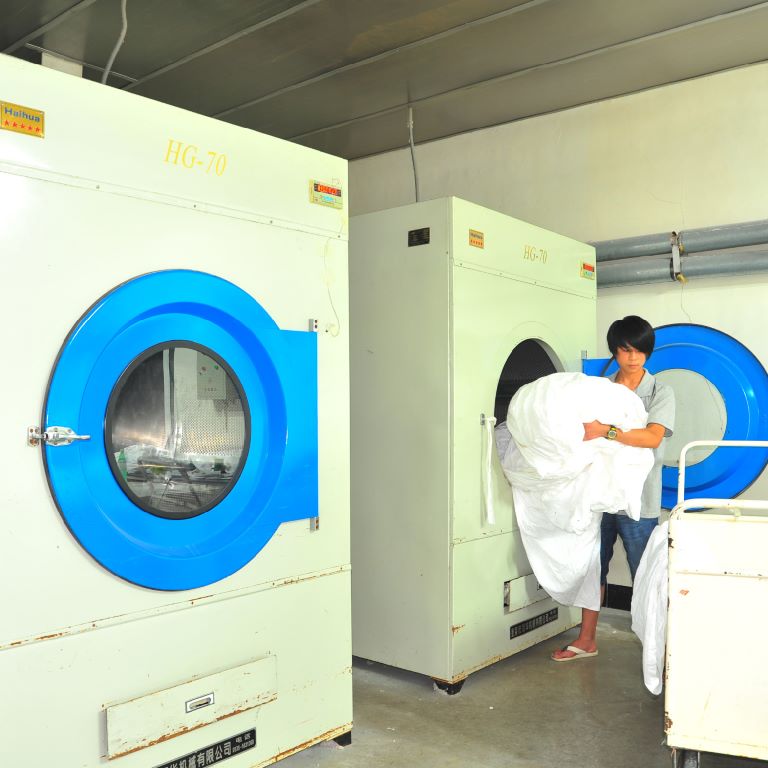
washing and drying
0.93743 kgCO2e/Kilowatt Hour
outgoing deliveries
1.1337 kgC02e/ Tonne Kilometre
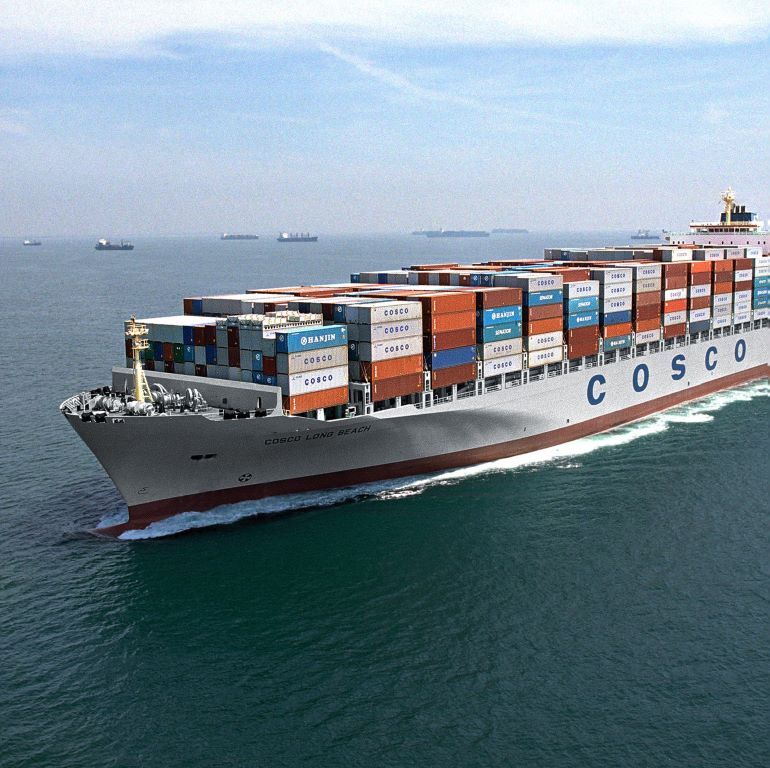
delivery to shops
0.00349 kgC02e/ Tonne Kilometre
Small World Offsets from January 2013 to date
| Period | Offset (VCUs) | Ratio of Emission vs Sales Amount (VCU per HKD) | Offset Perform | CDM Project |
|---|---|---|---|---|
| Oct 2022 - Dec 2023 | 40818 | CTX | "CDM Project ID346 Biomass Power Plant" | |
| Jul 2022 - Sep 2022 | 21063 | "CDM Project ID7943 Wind Power Project" | ||
| Jul 2021 - Dec 2021 | 28402 | Offset based on quantities of products | "CDM Project ID1966 Hydroelectric Station" | |
| Jan 2021 - Jun 2021 | 13420 | Verra | "CDP Project ID1938 Navigation and Power Generation Project" | |
| Jan 2020 - Dec 2020 | 24342 | "CDM Project ID4901 Hydroelectric Station" | ||
| Jan 2017 - Mar 2019 | 16660 | "CDM Project ID4901 Hydroelectric Station" | ||
| Apr 2013 - Sep 2016 | 15509 | "CDM Project ID4901 Hydroelectric Station" | ||
| Apr 2019 - Dec 2019 | 23510 | Reset ratio in Mar 19 Actual Emission 2124VCUs Ratio:0.1128 | "CDM Project ID4901 Hydroelectric Station" | |
| Oct 2018 - Mar 2019 | 9094 | "CDM Project ID4901 Hydroelectric Station" | ||
| Jul 2018 - Sep 2018 | 5313 | "CDM Project ID6580 Wind Farm Project" | ||
| Oct 2016 - Jun 2018 | 23586 | "Reset ratio in Sep 16 Actual Emission: 1081 VCUs Ratio 0.0753" | "CDM Project ID4901 Hydroelectric Station" | |
| Apr 2016 - Sep 2016 | 9251 | "CDM Project ID4901 Hydroelectric Station" | ||
| Oct 2015 - Mar 2016 | 10040 | "CDM Project ID6580 Wind Farm Project" | ||
| Oct 2013 - Sep 2015 | 41635 | "CDM Project ID4901 Hydroelectric Station" | ||
| Jan 2013 - Sep 2013 | 16516 | Emission in 2012: 22513VCUs Ratio: 0.0615 | Markit | "CDM Project ID3670 Wind Power Project" |
| Total | 299159 |
Our CDM Projects
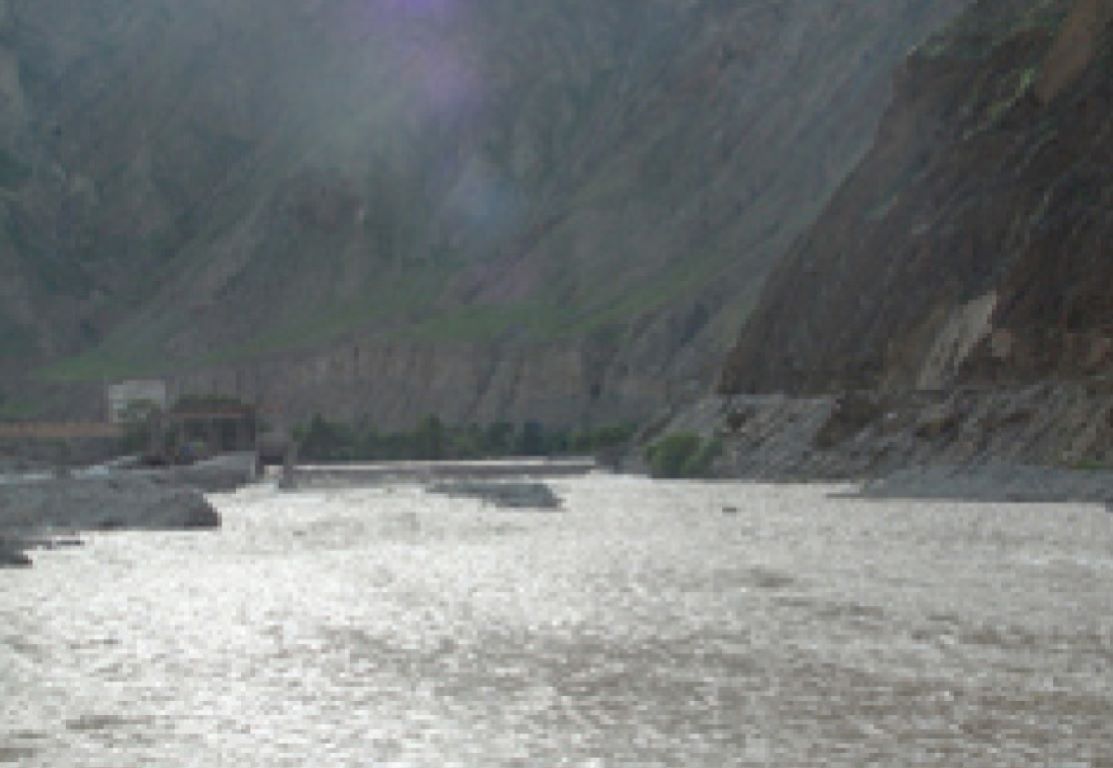
GANSU ZHANGYE HEIHE LONGHUI SMALL SCALE HYDROPOWER PROJECT
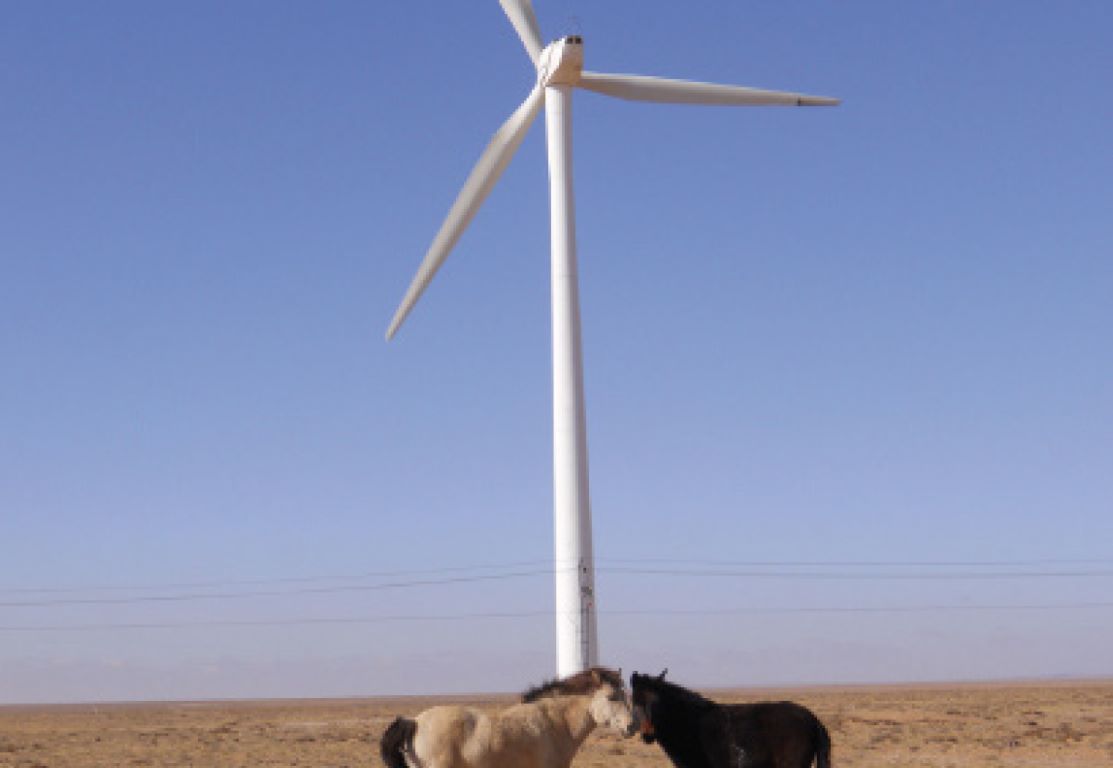
INNER MONGOLIA BAYINHANGGAI 49.5MW WIND FARM PROJECT
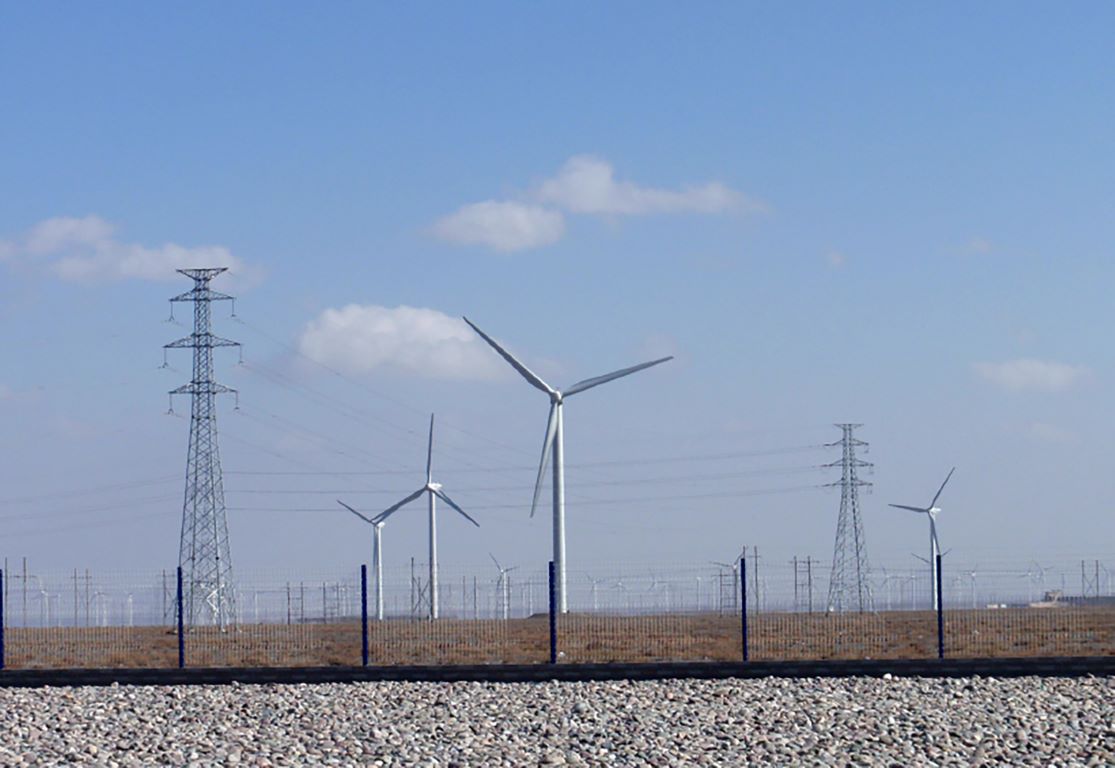
CECIC HKC GANSU CHANGMA WIND POWER PROJECT
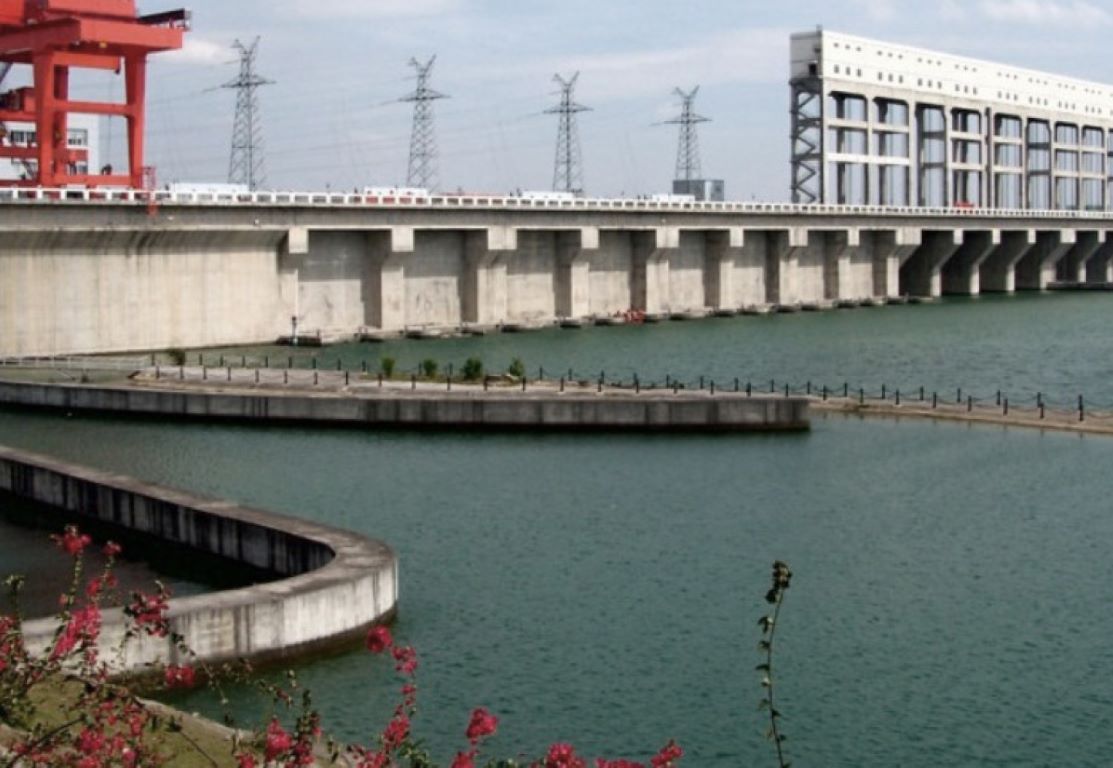
SICHUAN HUADIAN XIXI RIVER HYDRO-ELECTRICITY PROJECT